See network access
at a glance.
Explore the appliance views used to monitor service health, authentication activity and connected devices. These screenshots were captured from a PortGuardNAC lab appliance.
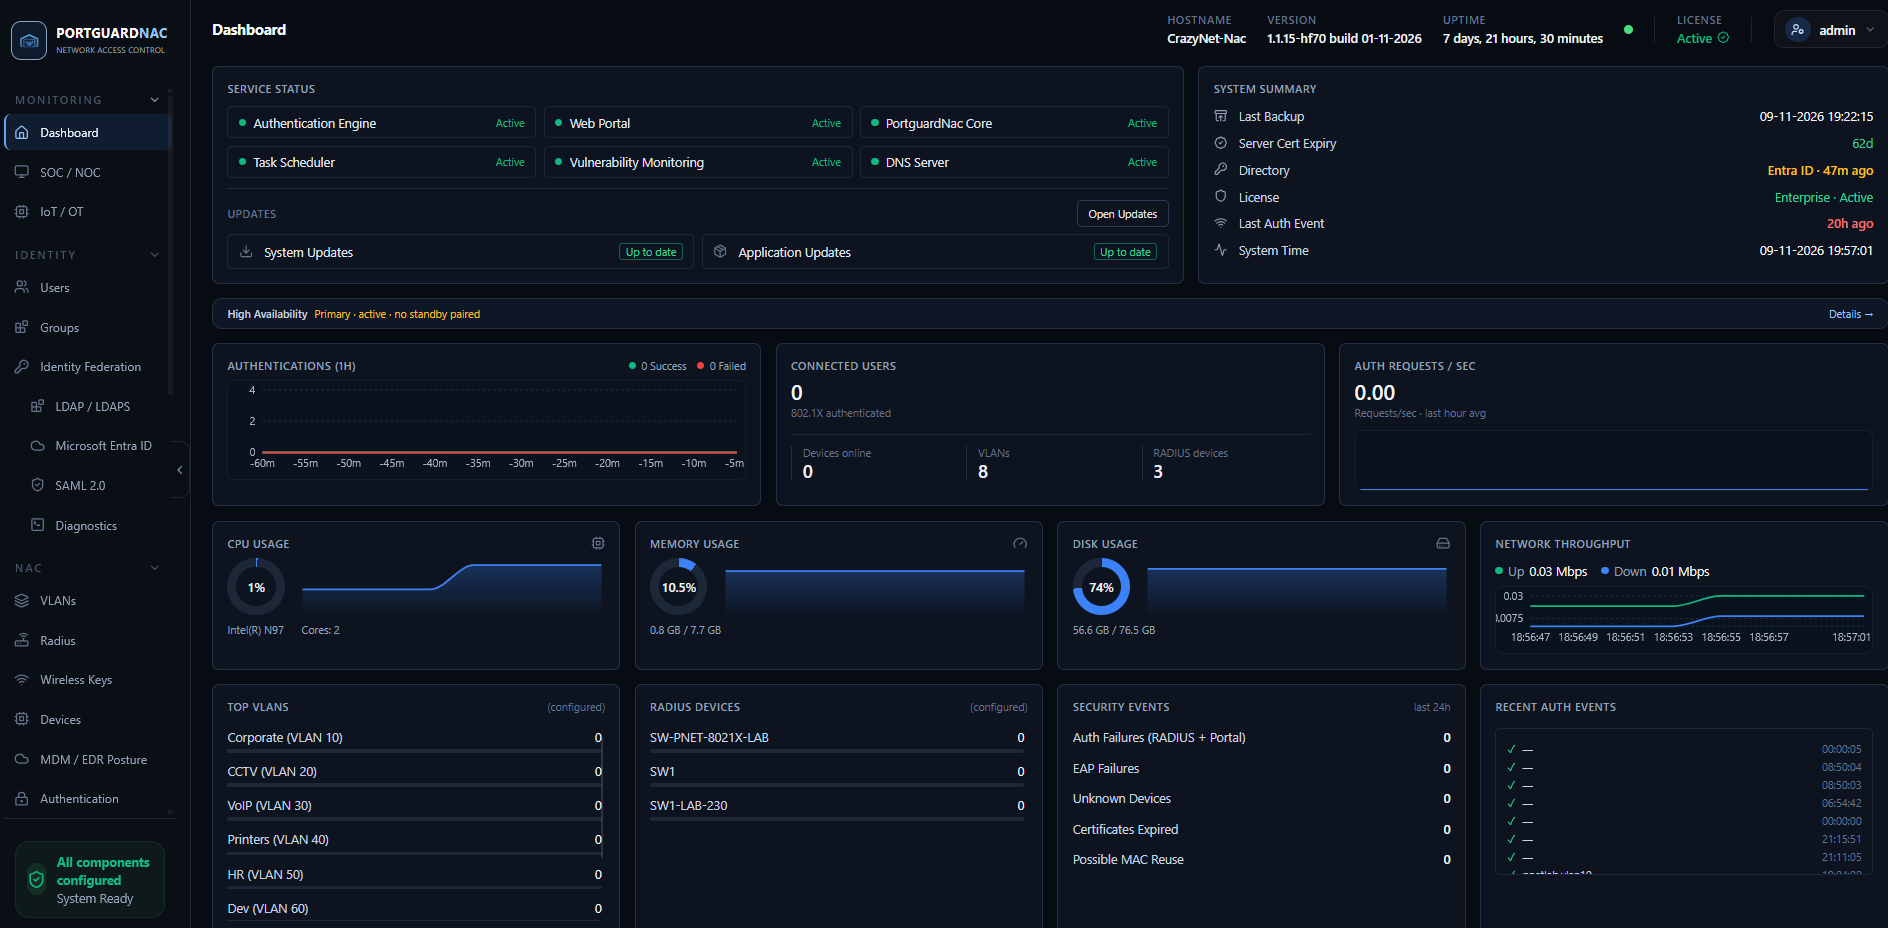
The whole appliance, one view
Check authentication and portal services, updates, recent access activity, VLANs and system resources from a single dashboard. Status indicators make operational issues easy to spot.
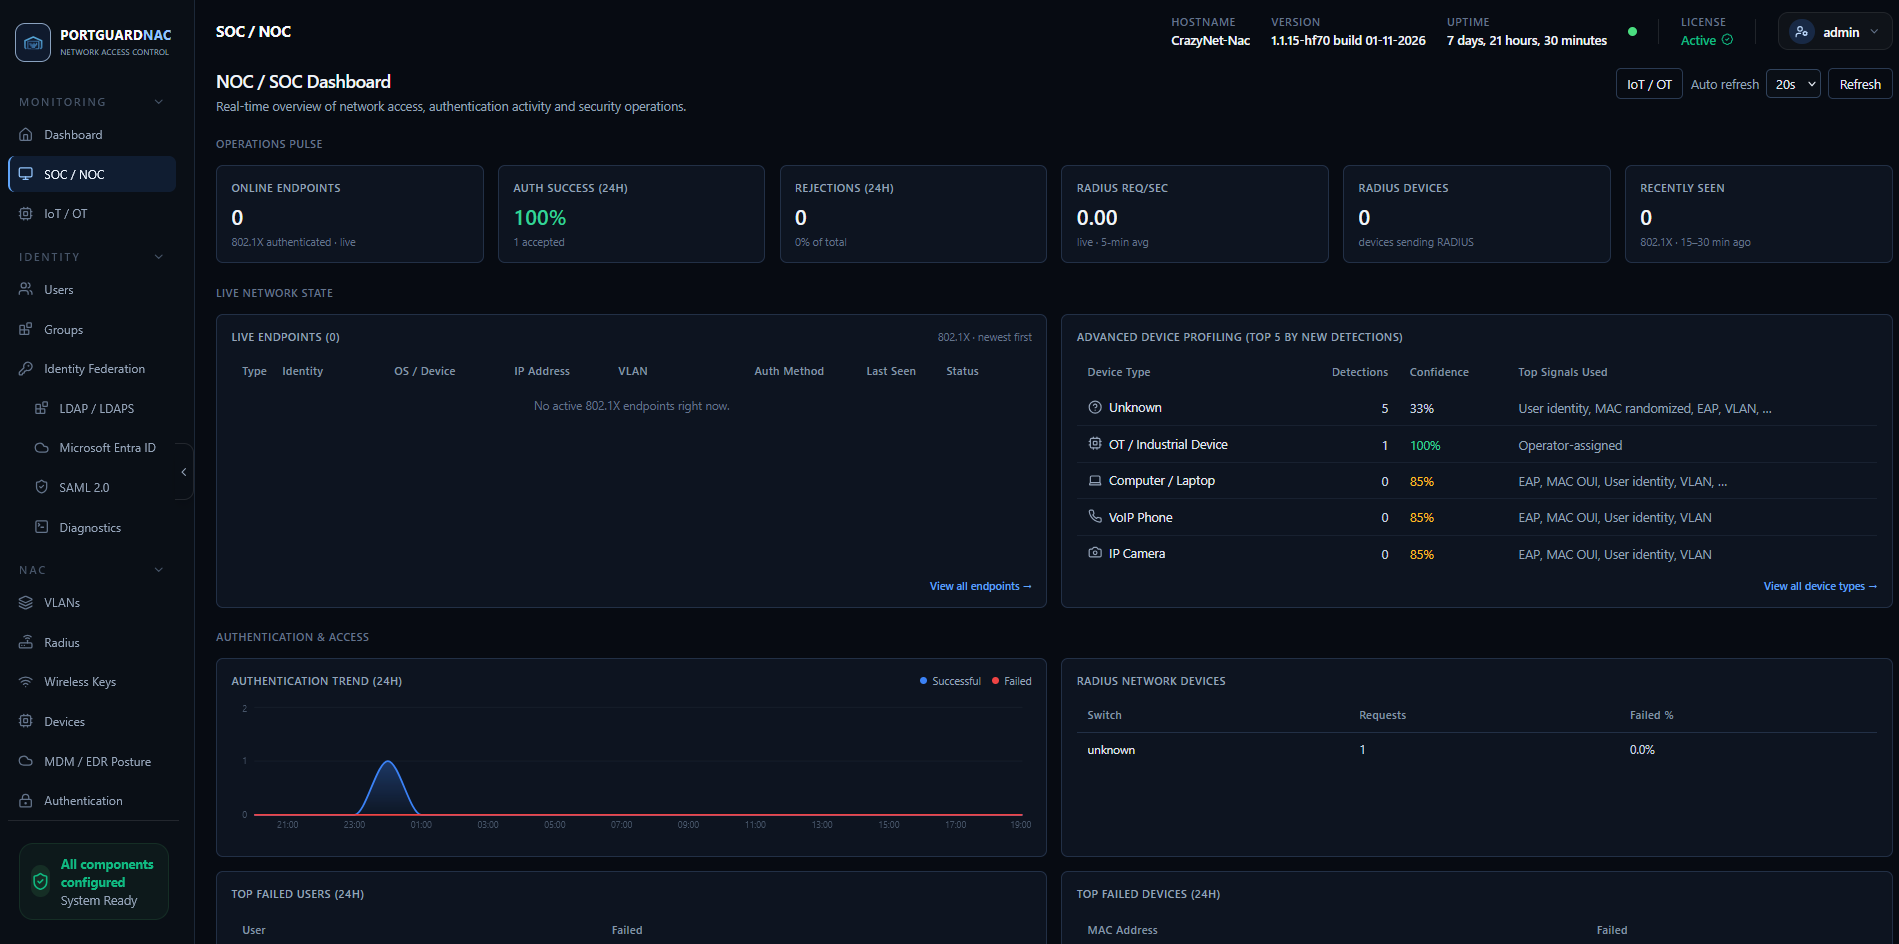
A shared view for SOC and NOC teams
Follow authentication outcomes, live endpoint presence, RADIUS requests and device profiling in one operational workspace. The view brings access and network signals together for triage.
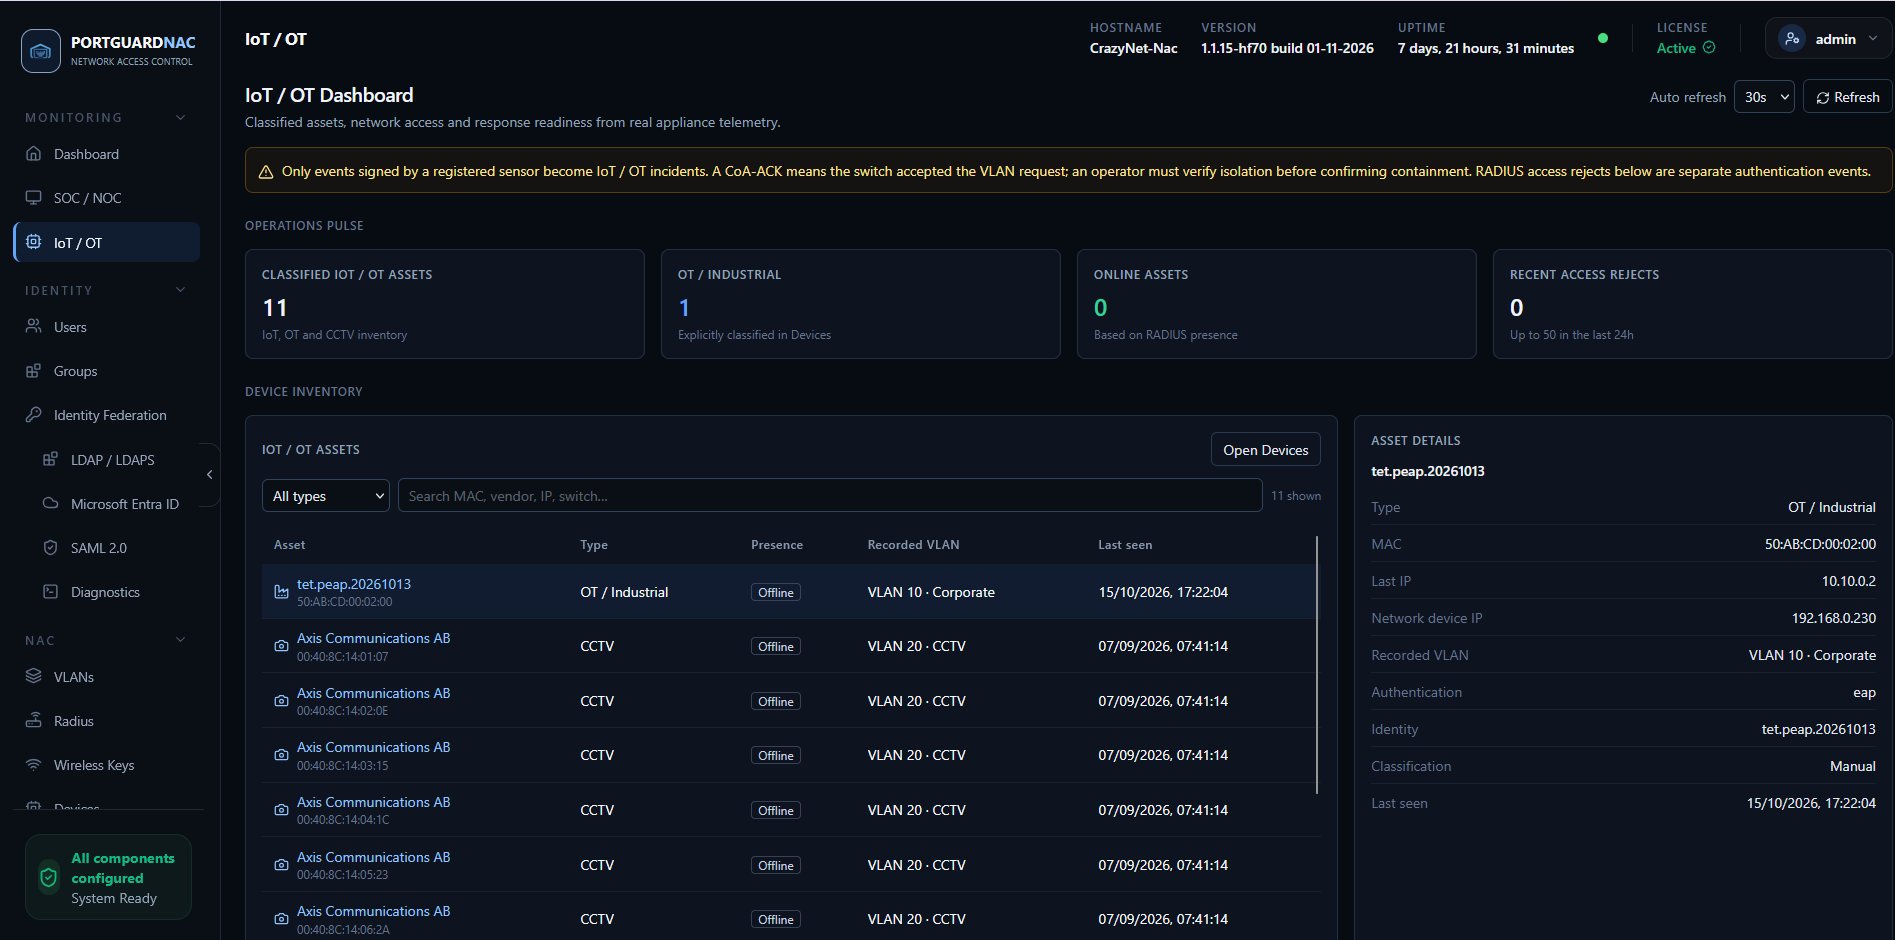
Understand classified assets
Review classified IoT, OT and CCTV assets alongside their recorded network assignments and recent access state. The IoT / OT dashboard is in supervised preview; sensor integrations and automatic switch response require site qualification.
Captured in a test environment on 09/11/2026. Names, counters and network details shown in the images are lab data; available features depend on the deployed release and configuration.